Make charts and other depictions for school, work, and other purposes
Make charts and other depictions for school, work, and other purposes
Vote: (8 votes)
Program license: Free
Developer: Graphs Made Easy
Version: (GME) Basic 3.1
Works under: Windows
Vote:
Program license
(8 votes)
Free
Developer
Version
Graphs Made Easy
(GME) Basic 3.1
Works under:
Windows
Pros
- User-friendly interface conducive to quick learning
- Direct manual data insertion for precise chart construction
- Interactive elements enhance data visualization
- Caters to customization needs with background color changes
- Supports multiple image formats for easy exportation
Cons
- Lacks the ability to import data from external sources
- Not suitable for complex data analysis or large data sets
- May be too basic for advanced users
Introduction to Graphs Made Easy
Graphs Made Easy is a dedicated graph creation tool that serves as a practical software solution when you need to visualize data in the form of charts and graphs. Targeted at users who require a straightforward method of turning their data into visual entities, it ensures that creating eloquent and direct charts is as uncomplicated as possible.
User Interface and Experience
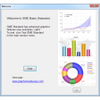
Upon launching Graphs Made Easy, users are greeted with an intuitive interface that simplifies the task of graph creation. The lack of clutter and a well-organized layout make the learning curve almost non-existent. This user-friendly approach accommodates even those with minimal technical knowledge, allowing them to jump right into crafting their desired visuals without a steep learning process.
Data Entry and Graph Creation
The focal point of the software is its manual data entry system. Unlike some complex data visualization tools that link to extensive datasets or spreadsheets, Graphs Made Easy adopts a more hands-on approach. Values are input one at a time, which could be seen as a basic method for constructing a chart's elements, whether it be the segments of a pie chart or the bars in a bar graph. However, this simplicity can be a significant advantage for small data sets or when precision is needed in data representation.
Interactivity within the created charts is a nifty feature. As users hover the mouse over individual graph segments, interactive tooltips appear, offering additional information. This could be particularly useful during presentations or when providing a data set with further context for better understanding.
Customization and Export Options
While the tool focuses on simplicity, it does not forsake customization. Users can tailor background colors to their taste or to match branding guidelines, ensuring that the final output aligns with the desired aesthetic. Once a graph is ready, the export functionality comes into play with several image formats supported, enabling users to integrate their visual data into reports or presentations with ease.
Extras like a print preview function and a date picker tool enhance Graphs Made Easy's usability. These thoughtful additions underscore the software's commitment to delivering a user-friendly experience without diving into the complexities of high-end data visualization software.
Performance for Simple and Quick Needs
Graphs Made Easy shines when the task at hand involves quickly generating simple and basic graphs. The application performs admirably, delivering quick results without overwhelming the user with a barrage of advanced options or intricate data management features. It's clear that the software has been designed with speed and simplicity in mind, which is ideal for less demanding graphical tasks.
For those in need of advanced analytical tools, intricate data manipulation, or integration with large-scale databases, Graphs Made Easy may not suffice. It is geared towards users who have straightforward graphing requirements or those who are in the initial stages of data analysis.
Conclusion
Graphs Made Easy stands out as a competent solution for users looking to quickly produce simple graphs without the need for sophisticated functionality. Its ease of use and decent customization options make it a practical choice for straightforward graph-making tasks.
Pros
- User-friendly interface conducive to quick learning
- Direct manual data insertion for precise chart construction
- Interactive elements enhance data visualization
- Caters to customization needs with background color changes
- Supports multiple image formats for easy exportation
Cons
- Lacks the ability to import data from external sources
- Not suitable for complex data analysis or large data sets
- May be too basic for advanced users